Happy Sunday!
In this week’s assignment, I am exploring spatial data visualization, using geographic maps to illustrate 2020 census data on Electric Vehicles (EVs) by state. The dataset I am working with was sourced from Kaggle and provides insights into two types of electric vehicles: Battery Electric Vehicles (BEVs) and Plug-in Hybrid Electric Vehicles (PHEVs), as currently registered through the Washington State Department of Licensing (DOL).
As requested per the assignment, I have chosen Tableau Public as my analytical tool. This robust platform perfectly suits the purpose of visualizing geographic data. Here is a glimpse of what I have accomplished:

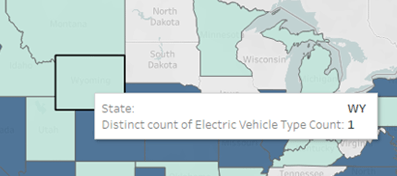
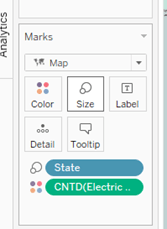
Our primary objective is to visualize the number of electric vehicles in each state. You will notice that I have represented this using two distinct colors on the map: light blue for one vehicle and dark blue for two. Additionally, I have incorporated a filter to enable visualization of vehicle counts based on their type.

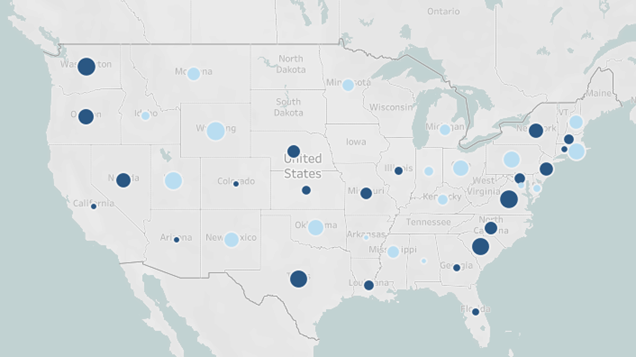
Tableau’s automatic features initially selected ‘Circle’ as the default visualization method. However, given the statewide nature of the data and the potential for numerous cities to have higher numbers of EVs, this approach might lead to a cluttered visual. Consequently, I opted for a cleaner, more intuitive ‘Map’ visualization method. This choice was influenced by the consideration that, with more extensive datasets, I might explore aggregating data by percentages or averages, which could merit using circles.
As I embark on this journey into data visualization, this is merely the beginning. I eagerly anticipate further data analysis to craft more meaningful visualizations that offer valuable insights. Stay tuned for more exciting developments!
