Hello again.
The assignment for this week is to create multi-variates visualizations.
Since my last assignment, I have wanted to explore the dataset from Kaggle about used Toyota Corolla Cars and if other variables impact the used Toyota Corolla cars. For this analysis, I will use multivariate correlation analysis. Therefore, I am focusing again on the variables “Age_08_04”, “Mfg_Year,” and “Price,” and I am adding “Weight” as a new variable. Let’s see how those variables yield insightful results regarding the influence on the Price of the Toyota Corollas in the dataset.
I will show the visualization first, then explain my findings, including the nature of the correlations (strong, moderate, weak) and the direction of their impact on the Price.
I will apply the design principles from Yaus’s book (Visualize This) for effective visual communication: Alignment, Repetition, Contrast, Proximity, and Balance. I have rendered the visualizations using a PDF format to simplify my tweaking, which made editing the label names and adding extra information to describe the correlation analysis easier. Here is the final result:
# Load required libraries
library(ggplot2)
library(corrplot)
#load the data
toyota_data<-read.csv('useyourfolderlocation/ToyotaCorolla.csv')
df = toyota_data
# Selecting the variables for this specific analysis
analysis_columns <- df[, c('Price', 'Age_08_04', 'Mfg_Year', 'Weight')]
# Calculating the correlation matrix for the selected variables
correlation_matrix_specific <- cor(analysis_columns)
# Plotting the correlation matrix
corrplot(correlation_matrix_specific, method = "color", col = colorRampPalette(c("blue", "white", "red"))(20),
type = "upper", order = "hclust", addCoef.col = "black", tl.cex = 0.7)
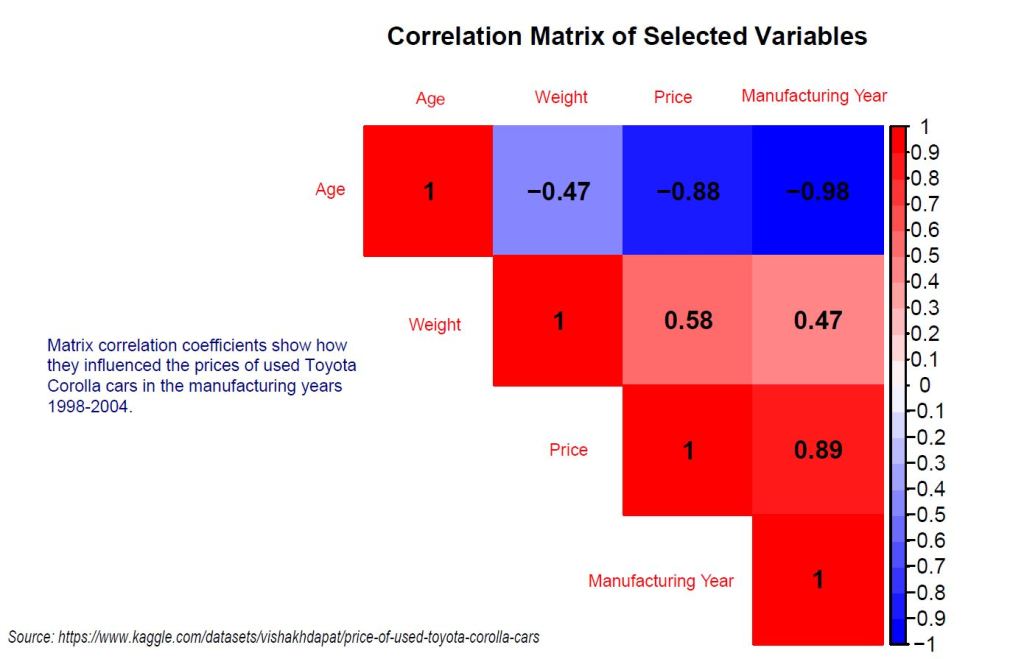
title("Correlation Matrix of Selected Variables")
Summary of Correlation Analysis:
1. Age of the Car (Age_08_04) and Price
- Correlation: Strong negative (-0.88)
- Implication: This correlation indicates that as the age of the car increases (indicating older vehicles), the price tends to decrease significantly. This relationship is intuitive as older cars are generally expected to cost less due to factors like wear and tear, outdated technology, and higher mileage, which may decrease their value.
2. Manufacturing Year (Mfg_Year) and Price:
- Correlation: Strong positive (0.89)
- Implication: A strong positive correlation between the car’s manufacturing year and price suggests that newer cars are priced higher than older models. This is likely due to advancements in technology, safety, fuel efficiency, and overall design aesthetics that come with newer models, making them more desirable and, thereby, more expensive.
3. Weight of the Car and Price:
- Correlation: Moderate positive (0.58)
- Implication: The moderate positive correlation between a car’s weight and price suggests that heavier cars tend to be priced higher. This could be due to several reasons. Heavier cars often have more features and larger engines or are in categories (like SUVs or luxury vehicles) that command higher prices. The increased material costs and engineering required to support the additional weight can contribute to a higher price point.
Explanation of Correlations:
Strong Correlations: Indicate an evident relationship between the variables, where a change in one variable is closely associated with a change in another. In this dataset, the car’s age and manufacturing year strongly correlate with price, indicating that these factors significantly influence a car’s market value.
Moderate Correlations: Suggest a relationship exists but isn’t as pronounced or consistent as with strong correlations. The car’s weight shows a moderate correlation with price, meaning that while there is a tendency for heavier cars to be more expensive, this relationship isn’t as direct or intense as the car’s age or manufacturing year.
Impacts on Price:
- The negative correlation between age and price means that as cars age, their prices tend to go down.
- The positive correlations for manufacturing year and weight with price mean that newer and heavier cars tend to be more expensive.
These findings provide valuable insights for buyers, sellers, and analysts into what factors are most influential in determining the price of a car in the used car market. They emphasize the significant impact of a car’s age and manufacturing year on its valuation and a moderate influence on its weight.
Of course, I wanted to expand the analysis by adding more variables and using corrgram library. Here is the visualization and brief description:
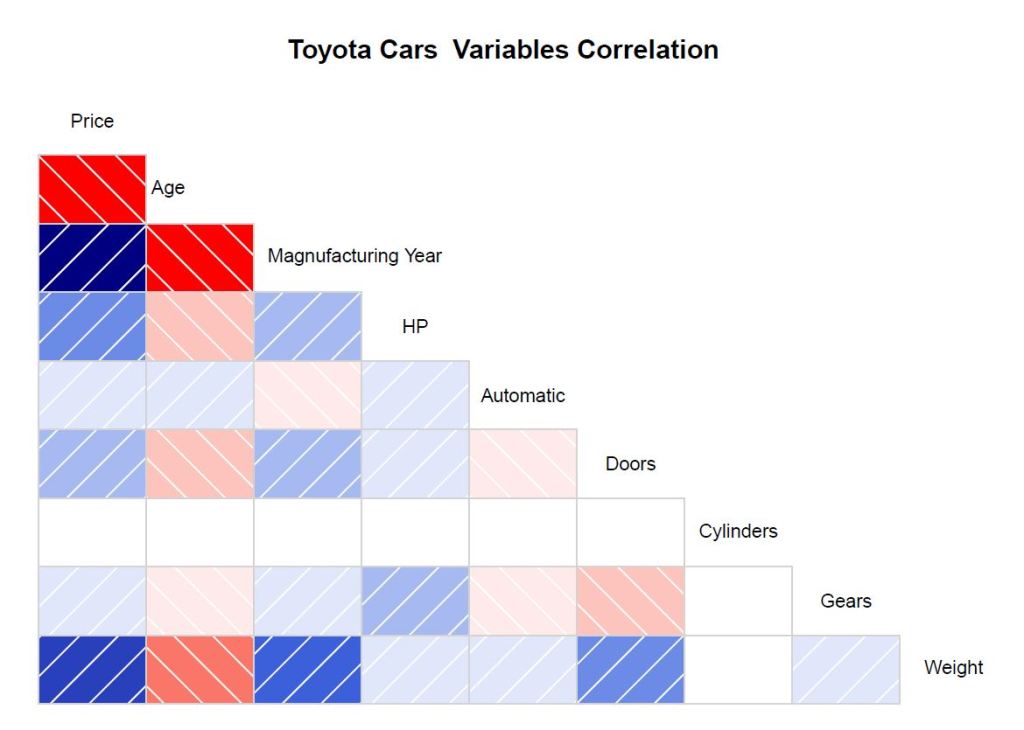
This visualization helps identify strong and weak correlations between the variables, mainly focusing on how they might affect the Price of Toyota cars. The corrgram provides a comprehensive view using color shades to represent the strength and direction of correlations (with darker shades often indicating stronger correlations).
As we saw above, there are strong correlations (positive or negative) between Price and other variables like Age, Manufacturing Year, or Weight. However, the impact of the other categorical variables (Automatic, Doors, Cylinders, Gears) on Price might reveal less intuitive relationships.
# Corrgram library
library(corrgram)

df_1 = subset(toyota_data,select= c(Price, Age_08_04,Mfg_Year,HP,Automatic,Doors,Cylinders, Gears, Weight))

#usign corrgram and other values
corrgram(df_1, order=NULL, lower.panel=panel.shade, upper.panel=NULL, text.panel=panel.txt, main="Toyota Cars  Variables Correlation")
References:
Few, S. (2021). Now you see it: Simple visualization techniques for quantitative analysis (pp. 191-219). Analytics Press.
STHDA. (2024). Correlation analyses in R. Retrieved from https://www.sthda.com/english/wiki/correlation-analyses-in-r
R Graph Gallery. (2024). Study correlations with a correlogram. Retrieved from https://r-graph-gallery.com/115-study-correlations-with-a-correlogram.html
Vishakh Dapat. (2024). Price of Used Toyota Corolla Cars [Data set]. Kaggle. https://www.kaggle.com/datasets/vishakhdapat/price-of-used-toyota-corolla-cars
Yau, N. (2011). Visualize this: The Flowing Data guide to design, visualization, and statistics (pp. 91-132). Wiley.
