Hello, Happy Sunday!
This is another assignment and another opportunity to learn R codes. This time, I will learn the basis of Social Network Analysis.
For this assignment, I have followed the steps posted by Dr. Bharatendra Rai in YouTube titled Social Network Analysis with R | Examples. I have also used his dataset ‘networkdata.csv‘ to complete this assignment.
Before starting the assignment, I recommended Dr. Bharatendra Ray’s video. The explanations and steps were straightforward to follow and understand.
Well, let’s begin.
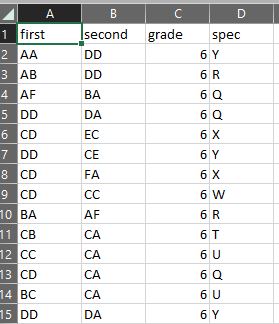
The networkdata.csv dataset contains four columns: “first,” “second,” “grade,” and “spec.” Following Dr. Bharatendra’s advice, I have decided to follow the ‘social media likes’ scenario, but I will name my analysis ‘Instagram Likes.’ Therefore, to create a network diagram, the instructions focuses on the “first” and “second” columns, which represent Instagram accounts where the “first” account likes a post by the “second” account. Next, I’ll proceed with creating a network diagram that visualizes the relationships between these Instagram accounts based on the “likes” interactions captured in the “first” and “second” columns.
Data Preview:
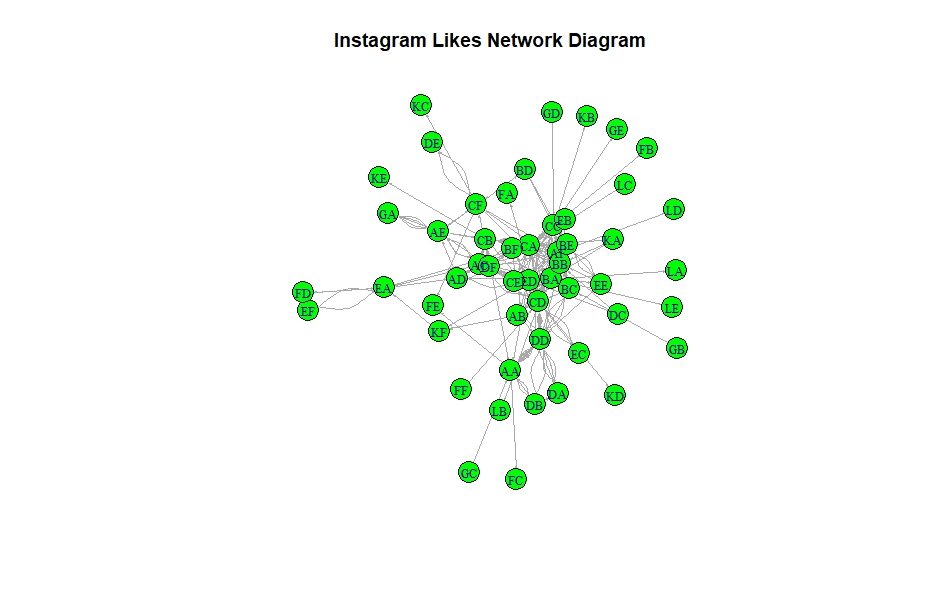
Network Diagram:
R Code:
library(GGally)
library(ggplot2)
library(network)
library(sna)
library(igraph)
library(readr)
networkdata <- read_csv("yourfolder/networkdata.csv")
View(networkdata)
#creating a datafram
y_net <- data.frame(networkdata$first,networkdata$second)
#Create  network
net <- graph_from_data_frame(y_net, directed = T)
#Network diagram
set.seed(222)
#plot(net)
plot(net,
     vertex.color = 'green',
     vertex.size =12,
     edge.arrow.size = 0.1,
     vertex.label.cex=0.8,
     main = 'Instagram Likes Network Diagram')
Above is the network diagram of Instagram account likes based on the network data dataset. Each node represents an Instagram account, and the directed edges (arrows) indicate that the account at the tail of the arrow likes a post by the account at the head of the arrow. It is also important to mention that ‘direction’ matters because it is not just who is connected to whom; it is about who initiates the action, which, in this case, is like a post.
Understanding these connections can help us see who the influencers are, how communities form around certain types of content, and how active or popular specific accounts are. It is like having a map of friendships and interests that helps us understand Instagram’s social dynamics. This kind of analysis is very useful for marketers, content creators, or anyone interested in better understanding social media interactions.
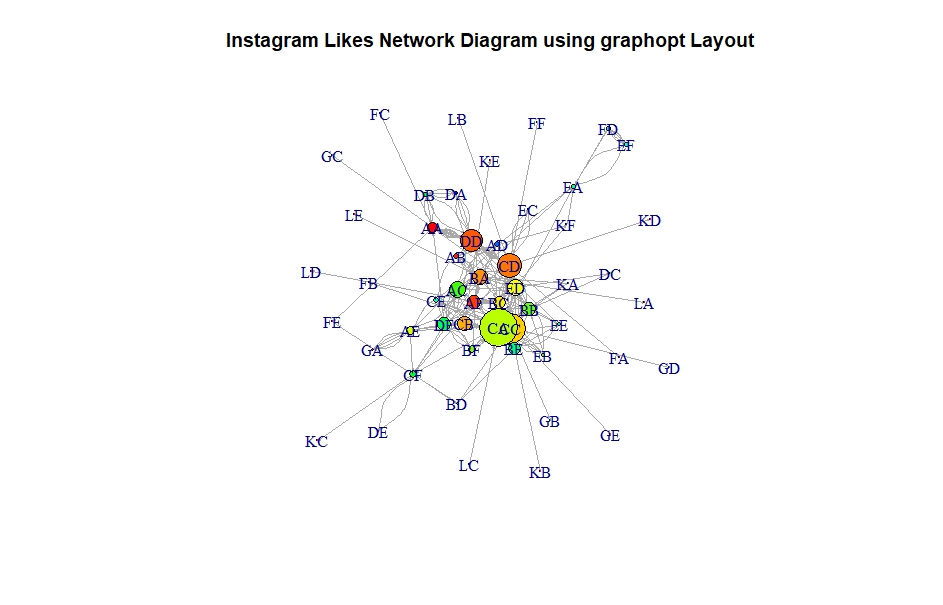
Furthermore, I am adding more graphs, showcasing the different layouts, degrees, and rainbow colors that enhance the visualizations.

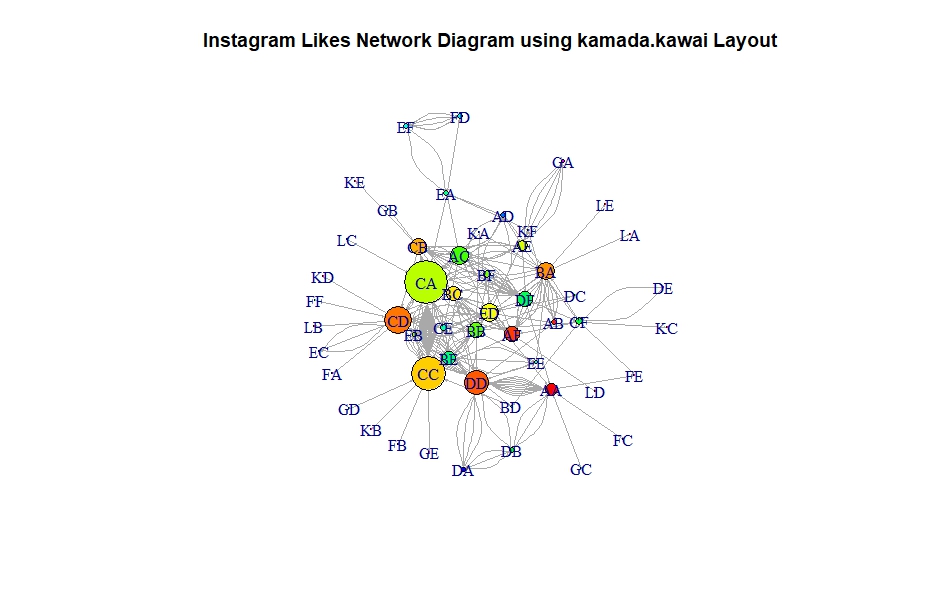
I personally like the Kamada.Kawai layout. The Kamada.Kawai’s layout is like organizing a room where everyone keeps a comfortable distance from each other but still stays as close as possible to their friends. This method tries to find the best spot for everyone.
R code:
#highlighting degrees & layouts
plot(net,
     vertex.color = rainbow(52),
     vertex.size = V(net)$degree*0.35,
     edge.arrow.size = 0.1,
     layout=layout.fruchterman.reingold,
     main = 'Instagram Likes Network Diagram using fruchterman.reingold Layout')


plot(net,
     vertex.color = rainbow(52),
     vertex.size = V(net)$degree*0.35,
     edge.arrow.size = 0.1,
     layout=layout.graphopt,
     main = 'Instagram Likes Network Diagram using graphopt Layout')

plot(net,
     vertex.color = rainbow(52),
     vertex.size = V(net)$degree*0.4,
     edge.arrow.size = 0.1,
     layout=layout.kamada.kawai,
     main = 'Instagram Likes Network Diagram using kamada.kawai Layout')
I could not help but add the Community Detection graph. I wanted to see what it looks like with the dataset I have used on this assignment.

R code:
# Community detection
net <- graph.data.frame(y_net, directed = F)
cnet <- cluster_edge_betweenness(net)
plot(cnet,
     net,
     vertex.size = 10,
     vertex.label.cex = 0.8,
     main= 'Community Detection'
     )
I was excited to see clusters of accounts that might share similar interests or interact more frequently with each other.
The community detection algorithm has identified distinct communities within the Instagram account likes network. In the diagram, each community is represented by a different color, grouping Instagram accounts that are more closely connected through likes.
I have really enjoyed this assignment because the dataset is very simple to analyze. This analysis offers a glimpse into how digital social interactions form patterns that can be visually and statistically analyzed, providing insights into the complex dynamics of social networks. I am looking forward to playing with more complex scenarios and datasets.
Reference:
Dr. Bharatendra Rai. (2024).Social Network Analysis with R | Examples. Retrieved from https://www.youtube.com/watch?v=0xsM0MbRPGE&t=893s
