Hello again Here is my final project in the class
1. Hypothesis Description
The hypothesis analyzed states:
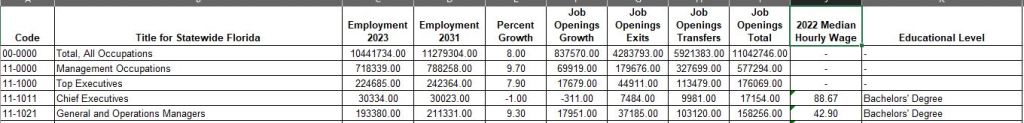
“From 2023 to 2031, Occupations requiring higher levels of education will experience higher percentage job growth and offer higher median wages compared to occupations with lower educational requirements in Florida.”
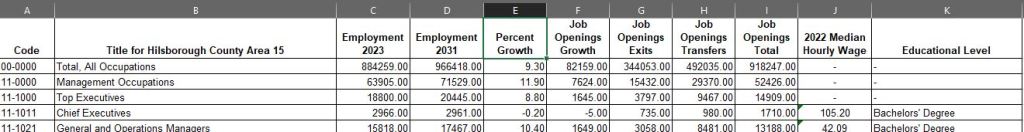
Specifically, I focused on comparing job growth and median wages in Hillsborough and Pinellas Counties to the entire state of Florida, aiming to identify potential career opportunities and economic benefits associated with higher educational attainment in these areas.

2. Methodology
I combined and cleaned data from multiple sources, specifically targeting Hillsborough, Pinellas, and statewide Florida.
I have computed average job growth and median wages across different educational categories to understand the general employment landscape, focusing mainly on higher education levels. By comparing these metrics between the two counties and statewide data, I can see the insights into where the counties stand in the broader state context.
Visualization:
I wanted something simple but powerful, so I used bar charts and a scatter plot to illustrate trends and comparisons clearly, making the data accessible and understandable. I think like better my bar charts for this project. I have struggled to get the scatter plot right for my selected dataset.
3. Technical and Statistical Approach
I explored relationships within the data using tools like pandas and seaborn in Python, focusing on identifying trends and correlations that support or refute the hypothesis. This is my first trying Python. My code is a little bit messy.
Educational levels were categorized into ‘Low,’ ‘Medium,’ and ‘High’ to simplify the analysis and focus on relevant groups.
Key metrics such as mean and average were calculated to summarize data points. These measures helped identify central tendencies and dispersions relevant to job growth and wages.
Visualization Techniques:
I employed bar charts to compare average values and scatter plots to examine the relationships between variables, enabling visual interpretation of complex data relationships.
Ranking Analysis:
I ranked occupations based on projected job growth to gain insights into occupational growth and provide a clear view of potential career opportunities.
Here are the visualizations to prove the hypotheses:
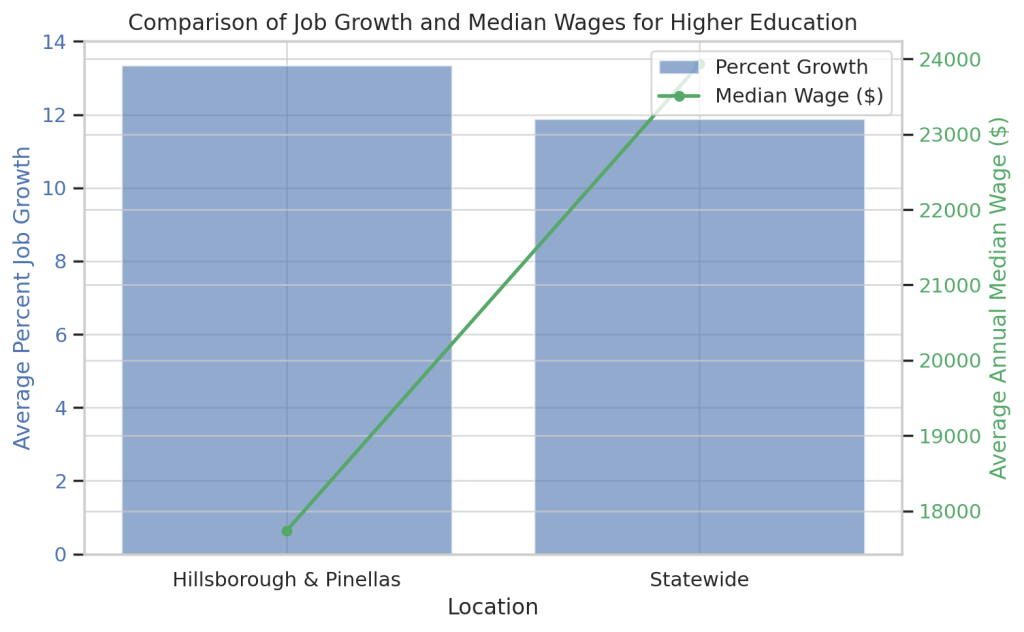
The dual-axis bar and line chart visually compares the average percentage of job growth and median wages for higher education-level occupations in Hillsborough and Pinellas Counties combined and the entire state of Florida.
Job Growth (Blue Bars): Hillsborough and Pinellas Counties show higher job growth rates (approximately 13.35%) than the statewide average of about 11.88%. This suggests a more robust job market for high-education-level occupations in these counties.
Median Wages (Green Line): Despite the higher job growth in the counties, the statewide median wage is higher, averaging around $23,930.68 annually, compared to $17,737.88 in Hillsborough and Pinellas Counties. This indicates that while more jobs are available in the counties, they offer lower wages than similar jobs across the state.
These insights are crucial for someone planning to pursue a career in Florida after graduating from university. While Hillsborough and Pinellas Counties may offer more opportunities in terms of job availability, it is essential to weigh these against the potentially higher earnings available statewide.

The chart highlights several occupations with significant projected job growth, indicating where the highest demand in the job market will likely be shortly.
The ranking can help understand specific career opportunities and plan educational and career paths aligned with these growth trends. This visualization helps pinpoint which high-education-required occupations are on the rise, aiding in decision-making for career development and potential relocation considerations.
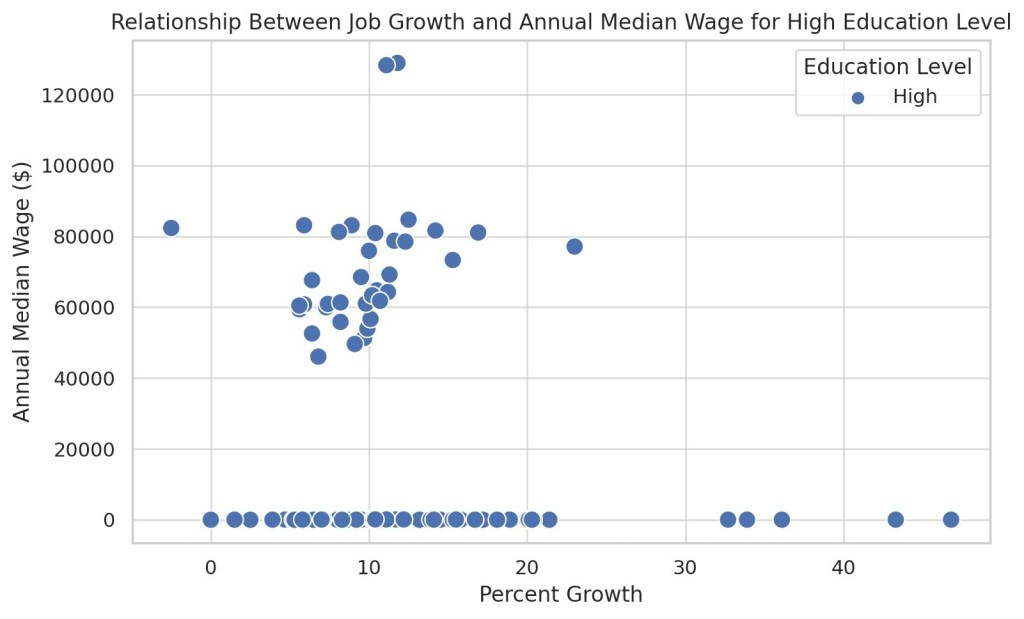
The scatter plot illustrates the relationship between percentage job growth and annual median wages for individual occupations requiring high education.
The plot reveals a data spread showing that while many high-education level occupations have a moderate to high percentage growth, the annual wages vary considerably. Some occupations with modest growth still offer high wages, suggesting that demand and industry specifics could drive wages more than growth rates alone.
This plot is handy for identifying outlier roles and general trends. It shows that high education often correlates with high growth and wages. However, the strength of this correlation can vary significantly depending on the specific job role.
My Sample python code for the visualization
import matplotlib.pyplot as plt import seaborn as sns

# Creating a bar chart for comparison between counties and statewide data
fig, ax1 = plt.subplots(figsize=(8, 5))
# Data preparation for plot
locations = ['Hillsborough & Pinellas', 'Statewide']
growth_rates = [comparison_data.loc[0, 'Percent Growth'], comparison_data.loc[1, 'Percent Growth']]
wages = [comparison_data.loc[0, 'Median_Hourly_Wage_2022'], comparison_data.loc[1, 'Median_Hourly_Wage_2022']]

# Bar chart for job growth
ax1.bar(locations, growth_rates, color='b', alpha=0.6, label='Percent Growth')
ax1.set_xlabel('Location')
ax1.set_ylabel('Average Percent Job Growth', color='b')
ax1.tick_params(axis='y', labelcolor='b')
ax1.set_title('Comparison of Job Growth and Median Wages for Higher Education')

# Create axis 2 for median wages
ax2 = ax1.twinx()
ax2.plot(locations, wages, color='g', marker='o', label='Median Wage ($)', linewidth=2)
ax2.set_ylabel('Average Annual Median Wage ($)', color='g')
ax2.tick_params(axis='y', labelcolor='g')

# Adding legend
fig.tight_layout() fig.legend(loc="upper right", bbox_to_anchor=(1,1), bbox_transform=ax1.transAxes) plt.show()


# Filter the combined counties data for 'High' education level and select relevant columns for job growth ranking
high_education_jobs = combined_counties_data[combined_counties_data['Education Category'] == 'High']
high_education_jobs = high_education_jobs[['Title', 'Percent Growth']].dropna().sort_values(by='Percent Growth', ascending=False)
# Create a visualization of the top occupations based on job growth
plt.figure(figsize=(10, 8))
sns.barplot(x='Percent Growth', y='Title', data=high_education_jobs.head(10), palette='coolwarm')

plt.title('Top Occupations by Job Growth in Hillsborough & Pinellas Counties')
plt.xlabel('Percent Job Growth')
plt.ylabel('Occupation')
plt.show()

# Setting up the data for Scatter plot
high_education_data = all_data_combined[all_data_combined['Education Category'] == 'High']

# Creating the visualizations
fig, axes = plt.subplots(1, 2, figsize=(14, 5))

 #Scatter plot for individual values
 fig, ax = plt.subplots(figsize=(8, 5))
 sns.scatterplot(data=high_education_data, x='Percent Growth', y='Median_Hourly_Wage_2022', hue='Education Category', style='Education Category', s=100)
 ax.set_title('Relationship Between Job Growth and Annual Median Wage for High Education Level')
 ax.set_xlabel('Percent Growth')
 ax.set_ylabel('Annual Median Wage ($)')
 ax.legend(title='Education Level')

 plt.tight_layout()
 plt.show()
Conclusion
The analytical and statistical methods employed provided a detailed understanding of the job market dynamics in Hillsborough and Pinellas Counties compared to the state of Florida. This analysis was crucial in helping me evaluate the potential for career opportunities in those Counties, considering both job growth and wage prospects. By focusing on higher education-level occupations, I can identify where the most significant growth could be expected, aiding in informed decision-making regarding potential relocation and career planning.
References
Visualizations helpers:
Florida Insight. https://floridajobs.org/economic-data/employment-projections/fastest-growing-industries
Florida Insight. Employment by Educational Attainment. https://floridajobs.org/economic-data/employment-projections/employment-by-educational-attainment
Florida Insight. Fastest Growing Occupations. https://floridajobs.org/economic-data/employment-projections/fastest-growing-occupations
Florida Commerce. https://www.floridajobs.org/workforce-statistics/data-center/statistical-programs/employment-projections#
