Welcome back to my analytics journey. Today, I’m tackling Module 5, where we explore matrices in R—specifically, how to find their inverse and determinant.
But here’s the catch… not all matrices play nice! Let’s break it down.
📌 The Challenge: Can These Matrices Be Inverted?
We were given two matrices:
A <- matrix(1:100, nrow=10) # 10×10 matrix
B <- matrix(1:1000, nrow=10) # 10×100 matrix
Now, we need to:
- Find the determinant of A (to check if it’s invertible, is that the right word? 😆).
- Compute the inverse of A (if possible).
- Check if B has an inverse (spoiler: it doesn’t).
Let’s investigate these matrix mysteries! 💡 Note: Please see my complete code on GitHub
Step 1: Checking A’s Determinant
A matrix must have a nonzero determinant to be invertible. Let’s check A:
det_A <- det(A)
print(det_A)
Result:
[1] 0
Uh-oh… A is singular! That means it has no inverse. ❌
Step 2: Trying to Invert A
Even though we know it won’t work, let’s see what happens when we try:
if (det_A != 0) {
A_inv <- solve(A)
print(A_inv)
} else {
print(“Matrix A is singular and has no inverse.”)
}
Result:
“Matrix A is singular and has no inverse.”
R was NOT having it! Since det(A) = 0, solve(A) refuses to compute an inverse.
Step 3: Checking B
B is 10x100—not square, meaning it can’t have an inverse. But let’s confirm:
if (nrow(B) == ncol(B)) {
print(“B is square, checking determinant…”)
det_B <- det(B)
print(det_B)
} else {
print(“Matrix B is not square and cannot have an inverse.”)
}
Result:
“Matrix B is not square and cannot have an inverse.” No surprises here!
Visualizing the Issue
To understand their structure better, let’s add a simple ggplot2 visualization of A and B as heatmaps.
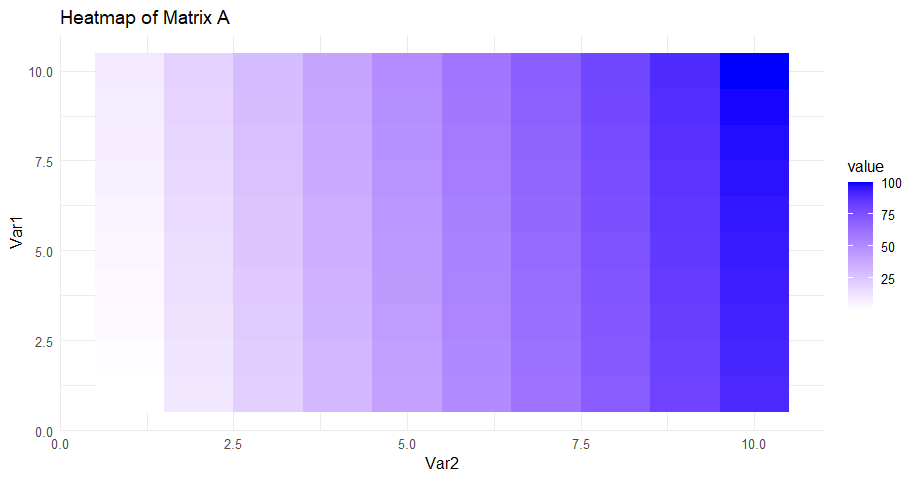
Instead of looking at a 10×10 table of numbers, a heatmap makes data relationships instantly clear.
In Matrix A, values increase from left to right, with darker shades indicating higher values. This gradient effect makes it easy to spot trends without scanning raw numbers.
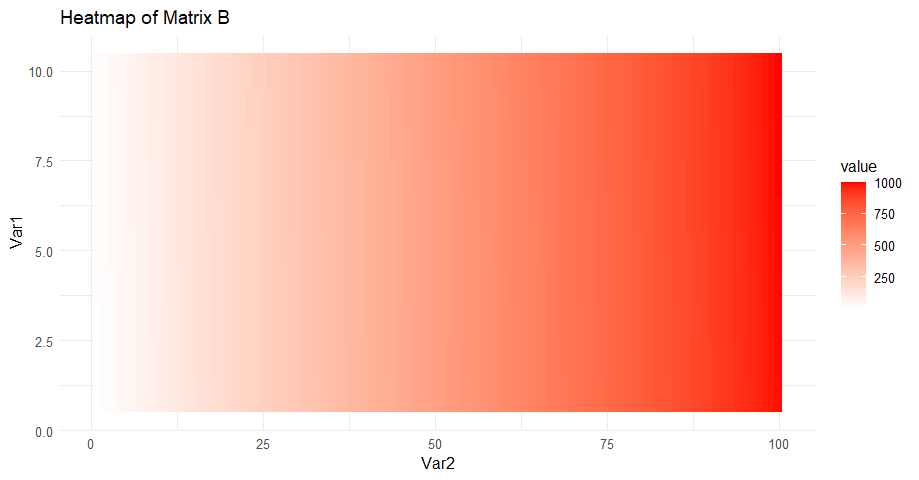
Matrix B is rectangular (10×100), and as we can see, it has more columns than rows, so it has no inverse. Heatmap Clue: A long horizontal shape suggests many more columns than rows.
Why a heatmap?
- It visually highlights the patterns in A and B.
- Helps understand data distribution in matrices.
- Looks awesome for blog readers! 😎
🎯 Key Takeaways
🔹 Matrix A is singular (det(A) = 0), so it has no inverse.
🔹 Matrix B is not square, meaning it doesn’t qualify for inversion.
🔹 Before using solve(A), always check det(A).
Final Thoughts
Not all matrices can be inverted, and this is a crucial concept in linear algebra, machine learning, and statistics.
📂 Check out my full code on GitHub!
💬 Let’s Chat!
❓ Ever had an R function refuse to cooperate? Drop your matrix horror stories in the comments! 😆
References:
InsightSoftware. (n.d.). When and why to use heat maps. Retrieved February 17, 2025, from https://insightsoftware.com/blog/when-and-why-to-use-heat-maps/
VWO. (n.d.). Heatmap analysis: Top 5 pages to focus your attention on. Retrieved February 17, 2025, from https://vwo.com/blog/heatmap-analysis-top-5-pages-to-focus-your-attention-on/
GetPlace. (n.d.). Heat maps: The complete guide. Retrieved February 17, 2025, from https://getplace.io/blog/heat-maps-the-complete-guide
