This is my last assignment for this summer class, and I’m excited to share my progress. It’s been a busy season, but a rewarding one, and as I wrap up this course, I know the learning journey will continue well beyond this summer.
For this assignment, I was drawn to the IBM HR Analytics Attrition dataset because behind every number, there’s a real person with a story. I wanted to explore the question: *What can the data tell us about why employees leave? Throughout this course, I learned how to use functions, classes, and Python’s visualization libraries to identify patterns that might help answer that question. This project allowed me to apply the skills I’ve recently developed. (To see the complete code, visit the GitHub repository: LIS4930_FinalProject)
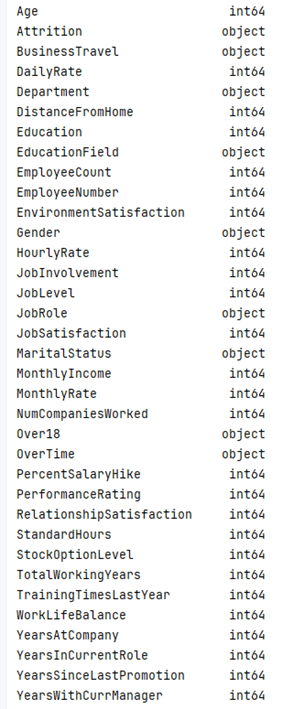
Dataset Overview
The dataset consists of 35 columns and 1,470 employees. It includes details such as job role, department, age, years of service, monthly income, satisfaction ratings, and whether the employee has left the company. It’s essentially a snapshot of a company’s workforce, showing both those who stayed and those who left, making it an excellent foundation for exploring turnover patterns. Each row represents an individual employee, and each column provides a different piece of context about their work experience.
My approach
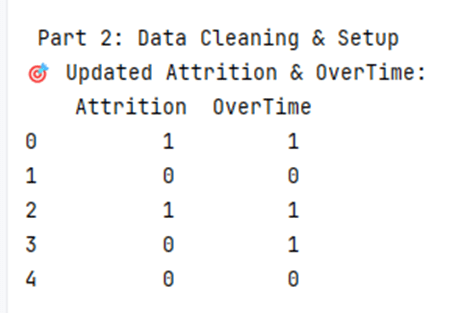
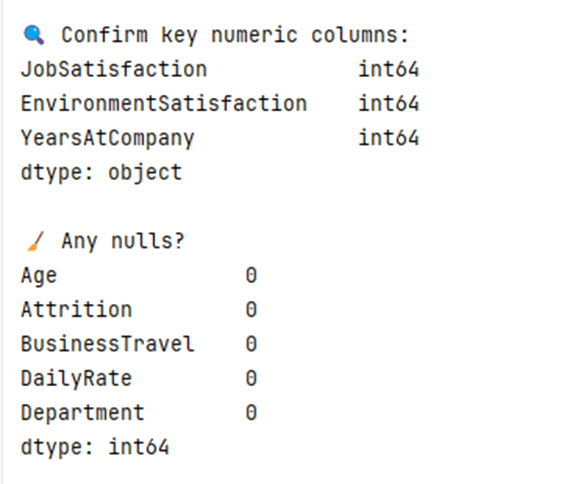
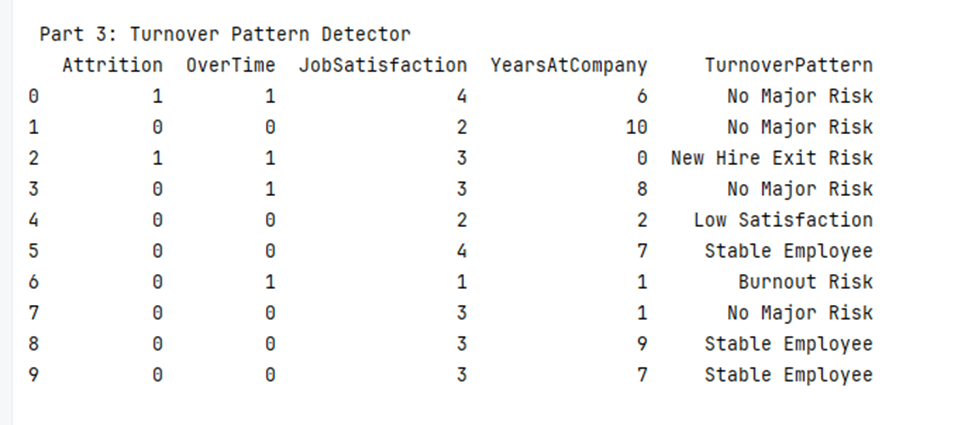
I began by cleaning the dataset and converting key columns such as “Attrition” and “OverTime” into numeric values. From there, I created logic-based categories to identify employee types: Burnout Risk, Low Satisfaction, New Hire Exit Risk, Stable Employee, and No Major Risk. These labels were based on clear, human-centered logic. For example, Burnout Risk included employees with low job satisfaction, high overtime, and fewer than three years of service at the company. After applying these labels, I visualized the results using Python’s matplotlib and seaborn libraries.
Visual Insights
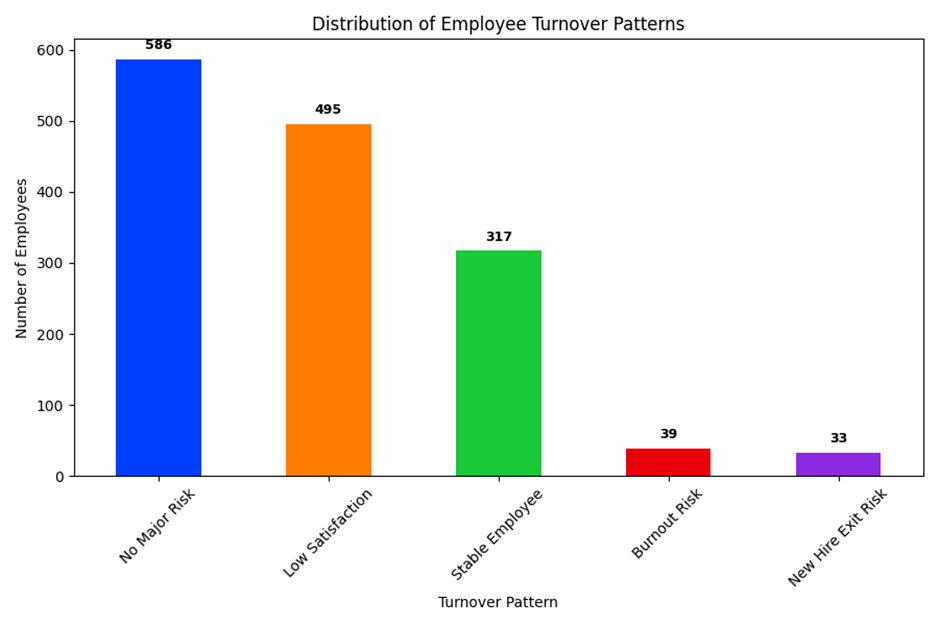
One of my key visuals is a bar chart showing the distribution of employee turnover patterns. The majority of employees fell into the “No Major Risk” and “Low Satisfaction” categories. It surprised me that only 317 employees were classified as “Stable”, meaning they were satisfied, long tenured, and not working overtime. Even more striking, just 39 employees were flagged as Burnout Risk. That’s a small group, but potentially a high-impact one. If so, many people are already dissatisfied. How can companies intervene before it becomes a resignation?
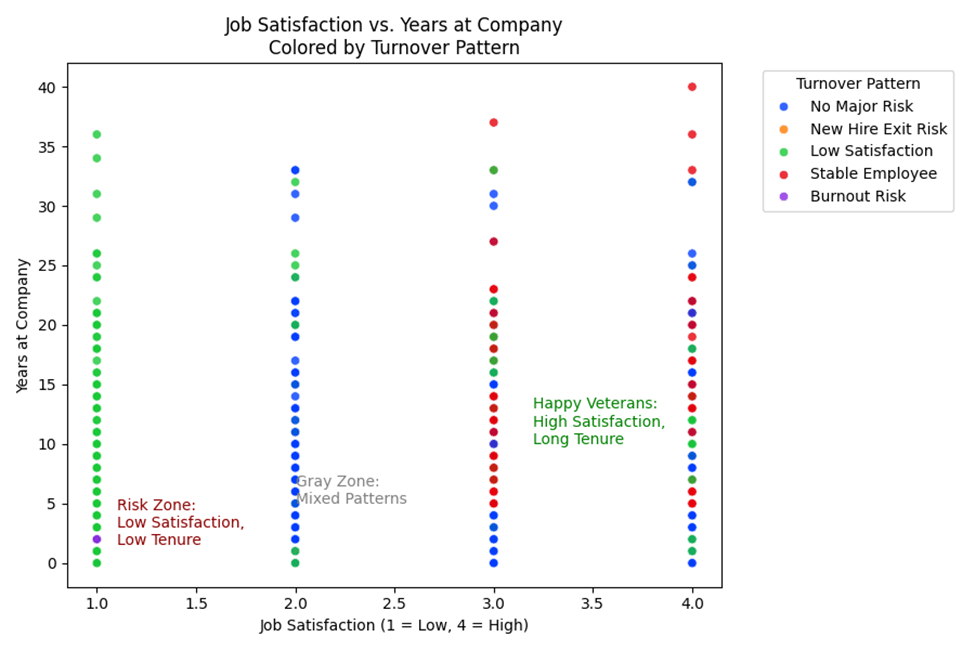
Another visualization mapped job satisfaction against years of service, with each employee color-coded by their turnover pattern. This revealed clear clusters, with low satisfaction and short tenure serving as red flags, and high satisfaction with long tenure indicating an ideal. In between, there was a “gray zone” of employees who didn’t clearly fall into one of the risk types. These visuals confirmed that even simple data logic can surface meaningful insights about workplace trends and employee behavior.
Final Reflections
This project taught me more than how to write Python classes or build a chart. It taught me to ask better questions, stay curious, and tell a story with data. I now have a better understanding of how code can help us make sense of human behavior, and how visual storytelling can reveal patterns that raw spreadsheets often miss. Whether you’re in HR, data science, or just exploring, I hope this project helps you see the story inside the stats.
You can view the complete code and the README file in my GitHub repository: LIS4930_FinalProject.py
Thanks for joining me on this journey!
