Since I am a remote worker, I would like to know how other remote workers worldwide handle work-life balance. While searching for dataset samples, I found data sets from Kaggle that combine several variables in several cities worldwide to measure work-life balance from 2021-2022. to add more context to the analysis, I have also added another data set with the categories and index scores of various well-being indices for 2020-2022.
My Hypotheses:
H1: “American remote workers have higher work-life balance than European remote workers.”
H0: “American remote workers do not have a higher work-life balance than European remote workers.”
To analyze the hypothesis that “American remote workers have higher work-life balance than European remote workers,” I will first examine the data sets I have found. The analysis will involve comparing metrics relevant to work-life balance between cities or regions in the United States and Europe. The files are:
1. “Cities with the Best Work-Life Balance 2022.csv”
2. “continents2.csv”
3. “Wellbeing-Indices.xlsx”
The first dataset, “Cities with the Best Work-Life Balance 2022,” includes the following key columns:
- City
- Country
- Remote Jobs Percentage
- Overworked Population Percentage
- Minimum Vacations Offered (Days)
- Vacations Taken (Days)
- Unemployment Rate
- Multiple Jobholders Percentage
- Other relevant metrics such as Healthcare, Inclusivity and tolerance, Affordability, Happiness, Culture and leisure, City Safety, Outdoor Spaces, Air Quality, Wellness, and Fitness
- Total Score for WorkLife Balance
This dataset provides comprehensive information about work-life balance in various cities worldwide, including European and American cities.
Next, I will examine the contents of the second file, “continents2.csv,”
The second dataset, “continents2.csv,” includes country names and their respective continent categorizations. Key columns include Country Name (`name`),
Continent (`region`), Sub-region
This data is useful to categorize each city in the first dataset as either in Europe or North America, aiding in the comparison needed for our hypothesis.
The third dataset, “Wellbeing-Indices.xlsx,” provides a range of indices related to the well-being of different countries. Key columns in this dataset include:
- Economy (Country Name)
- CountryCode
- IncomeGroup
- Gross National Income per Capita (GNIPC)
- World Happiness Score (WHS)
- Human Development Index (HDI)
- Gender Development Index (GDI)
- Gender Inequality Index (GII)
- Inequalityadjusted Human Development Index (IHDI)
- Physical Health Development Index (PHDI)
- Sustainable Development Goals Index (SDGI)
- Social Progress Index (SPI)
- Multidimensional Poverty Index (MPI)
Now, to analyze the hypothesis that “American remote workers have higher worklife balance than European remote workers,” I will:
1. Merge the “Cities with the Best WorkLife Balance 2022” dataset with the “continents2.csv” dataset to categorize each city by continent.
2. Focus on cities in Europe and North America.
3. Use relevant metrics from the first dataset and, if necessary, supplement them with countrylevel indices from the “WellbeingIndices.xlsx” dataset.
4. Perform statistical analyses to determine if there is a significant difference in worklife balance metrics between American and European cities.
The following steps in our analysis will be:
1. Statistical Analysis: We will perform statistical tests to determine if there is a significant difference in worklife balance metrics between cities in Europe and North America. We can use the ‘TOTAL_SCORE’ as a comprehensive metric for worklife balance. Additionally, we can investigate specific metrics like ‘Remote Jobs,’ ‘Overworked Population,’ ‘Minimum Vacations Offered,’ and ‘Vacations Taken.’
2. Comparative Analysis: We will compare the average values of key metrics between the two continents.
Let us proceed with the statistical analysis.
I will start by comparing the ‘TOTAL_SCORE’ for worklife balance between European and North American cities to see if there is a significant difference. For this, I will use a t-test to compare the means of two independent groups.
The t-test comparing the ‘TOTAL_SCORE’ for worklife balance between European and North American cities yielded a t-statistic of approximately 1.83 and a p-value of about 0.11
> # Performing a t-test
> t_test_result <- t.test(european_scores$TOTAL_SCORE, north_american_scores$TOTAL_SCORE, na.action = na.omit)
>
> t_stat <- t_test_result$statistic
> p_value <- t_test_result$p.value
>
> c(t_stat, p_value)
t
1.8317867 0.1128524
There is evidence of a difference in mean scores between European and North American cities. However, this evidence is insufficient to conclusively reject the null hypothesis of no difference (since p > 0.05). The means suggest European cities have a higher score, but the confidence interval and p-value do not provide enough statistical certainty to state this conclusively.
This result contradicts the null hypothesis that “American remote workers have higher work-life balance than European remote workers.” Instead, based on the ‘TOTAL_SCORE’ metric, European cities tend to have a better work-life balance.
Next, we can perform a comparative analysis on specific metrics like ‘Remote Jobs,’ ‘Overworked Population,’ ‘Minimum Vacations Offered,’ and ‘Vacations Taken’ for a more detailed understanding. Let us calculate these metrics’ average values for European and North American cities.
The average values for key metrics related to work-life balance in European and North American cities are as follows:
European Cities:
- Average Percentage of Remote Jobs: 38.06%
- Average Percentage of Overworked Population: 12.18%
- Average Minimum Vacations Offered (Days): 21.52
North American Cities:
- Average Percentage of Remote Jobs: 33.22%
- Average Percentage of Overworked Population: 11.04%
- Average Minimum Vacations Offered (Days): 11.43
These comparisons reveal some interesting insights:
- The percentage of remote jobs is higher on average in European cities compared to North American cities.
- European cities also have a slightly higher percentage of overworked population.
- A significant difference is observed in the average minimum vacations offered, with European cities offering almost double the days compared to North American cities.
· > list(averages_europe, averages_north_america)· [[1]]· Remote_Jobs Overworked_Population · 0.003805852 0.001217778 · Minimum_Vacations_Offered__Days_ Vacations_Taken__Days_ · 21.518518519 25.696153846 · · [[2]]· Remote_Jobs Overworked_Population · 0.003322429 0.001104286 · Minimum_Vacations_Offered__Days_ Vacations_Taken__Days_ · 11.428571429 18.166666667
These extra findings, support the earlier statistical result that European cities have a better work-life balance than North American cities, even if the results are not fully conclusive. Still this suggests that the null hypothesis (“American remote workers have higher work-life balance than European remote workers”) is not supported by this data.
A good work-life balance is crucial for a more productive and happy worker.
Continuous work without adequate breaks or leisure time can lead to burnout and physical and emotional exhaustion. Burnout not only diminishes productivity but can also lead to serious health issues. A balanced work-life schedule helps prevent burnout, keeping individuals energized and more capable of handling work-related tasks. This exercise it is helping me research and prove with data if my assumptions are correct and then find the correct solutions.
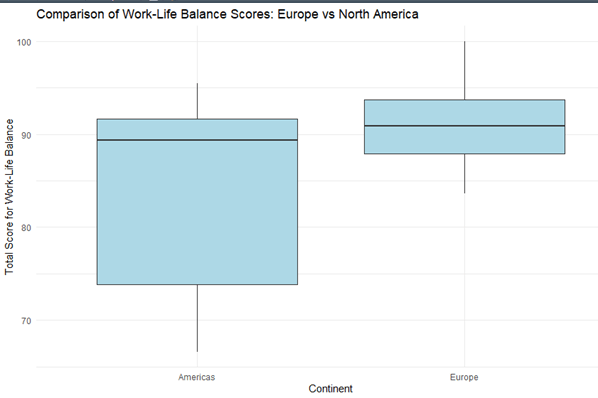
Here are the visualizations to show the comparison as well as the R code
# Load the required library
library(ggplot2)
# Create a boxplot for European and North American countries
ggplot(europe_and_north_america_countries_data, aes(x = region, y = TOTAL_SCORE)) +
geom_boxplot() +
ggtitle(‘Comparison of Work-Life Balance Scores: Europe vs North America’) +
ylab(‘Total Score for Work-Life Balance’) +
xlab(‘Continent’)
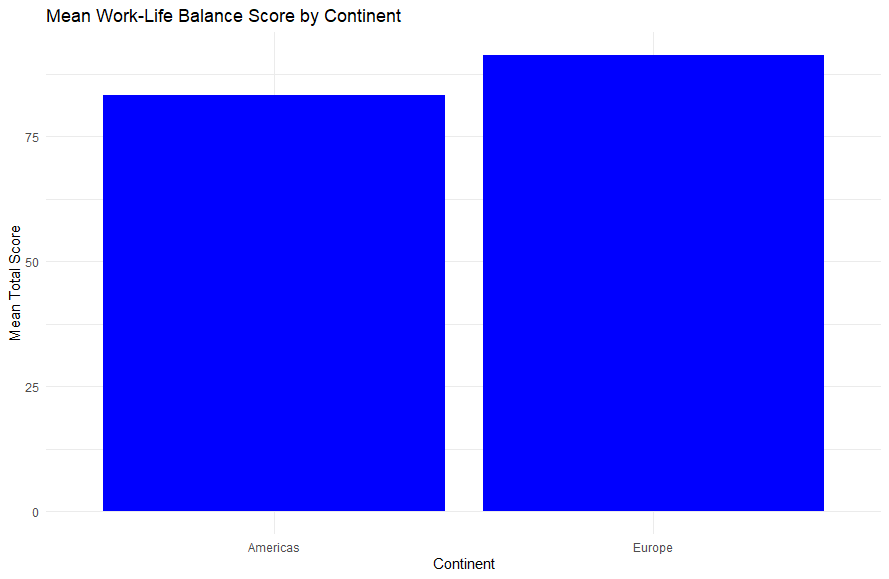
# Bar plot for mean Total Score by continent
library(ggplot2)
ggplot(continent_mean_scores, aes(x = region, y = MeanTotalScore)) +
geom_bar(stat = “identity”, fill = “blue”) +
labs(title = “Mean Work-Life Balance Score by Continent”,
x = “Continent”,
y = “Mean Total Score”) +
theme_minimal()